Recovering Aluminum Extrusion Profiles: The Economic Case.
- Silvio Ruiu

- Mar 9
- 4 min read
Updated: Mar 11
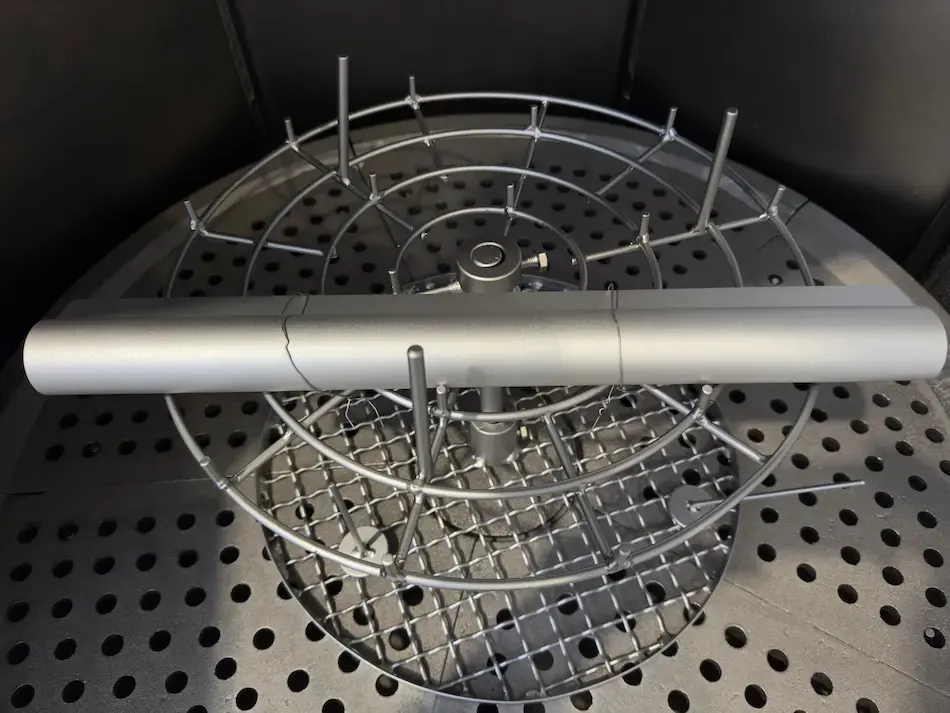
The previous article described what the wheel blaster does technically. This one puts numbers on it.
The number first.
A mid-size extrusion plant — single press, 50 T/day US or 35 T/day EU, finishing mix of 40% anodizing and 60% powder coating — recovers its investment in the wheel blaster and handling system in:
US — mid-size plant | EU — mid-size plant | |
$1.764M-$2.117M | Capex — machine + handling | €1.5M-€1.8M |
$1,852,500-2,872,500/year | Total annual benefit | €1,147,200-1,784,100/year |
7.4 - 13.7 months | Payback period | 10.1 - 18.8 months |
What follows is the math.
The baseline.
Field data attributes 5% of total extruded weight to surface defects connected to extrusion line conditions. On a mid-size plant running 300 days per year:
US — mid-size plant | EU — mid-size plant | |
2.5 T/day | Surface defect scrap | 1.75 T/day |
$6,250 | Daily cost at aluminum price | €4,025 |
$1.875M | Annual cost (300 days) | €1.2M |
This is the floor. The three vectors below build on top of it.
Vector 1 — Profiles recovered instead of remelted.
A profile that fails at any point in the process carries the full value of everything that went into it. When it goes to remelting, that value is destroyed. What comes back is secondary aluminum, at a recovery value significantly lower than the primary material it started as.
The wheel blaster changes the destination. The profile does not go to remelting. It goes back into the process — at the point where it failed, with its full weight intact. 99% of profiles that pass through the machine are recovered.
The delta is not the price of aluminum. It is the price of aluminum plus every transformation cost already absorbed.
Field data indicates that surface defects distribute across the process as follows: 80% are identified post extrusion, 10% post anodizing, 10% post powder coating.
Post extrusion | Post anodizing | Post powder coating | |
Profile value at failure | ~$2,500/T / ~€2,126/T | ~$3,700-3,900/T / ~€3,146-3,316/T | ~$3,700-3,900/T / ~€3,146-3,316/T |
Remelt recovery value | ~$1,000-1,500/T / ~€850-1,275/T | ~$1,000-1,500/T / ~€850-1,275/T | ~$1,000-1,500/T / ~€850-1,275/T |
Value preserved per ton | ~$1,000-1,500/T / ~€850-1,275/T | ~$2,200-2,900/T / ~€1,870-2,466/T | ~$2,200-2,900/T / ~€1,870-2,466/T |
US — mid-size plant | EU — mid-size plant | |
$3,100-4,450/day | Daily benefit Vector 1 | €1,844-2,647/day |
$930,000-1,335,000/year | Annualized (300 days) | €553,200-794,100/year |
Vector 2 — Remelting cost eliminated.
Vector 1 measures the value of the profile recovered. Vector 2 measures something separate: the active cost of remelting itself — energy, transport, processing — that is eliminated when the profile goes back into the process instead of the furnace.
USD | EUR | |
Remelting process cost | $200-500/T | €185-460/T |
US — mid-size plant | EU — mid-size plant | |
$500-1,250/day | Daily benefit Vector 2 | €324-805/day |
$150,000-375,000/year | Annualized (300 days) | €97,200-241,500/year |
Vector 3 — Weight preserved in the anodizing bath.
Traditional caustic etching removes aluminum to eliminate surface defects. Mass dissolved in the bath is mass not invoiced. The mechanical etching stage eliminates this loss — the chemical bath is reduced from 20 minutes to 2 minutes, leaving caustic soda no time to dissolve aluminum.
For a plant processing 40% of its production through anodizing, a conservative estimate of 3-5% weight loss in the traditional process represents 30-50 kg/day of aluminum dissolved instead of sold.
US — mid-size plant | EU — mid-size plant | |
30-50 kg/day | Aluminum preserved | 21-35 kg/day |
$75-$125/day | Daily benefit Vector 3 | €48-€80/day |
$22,500-$37,500/year | Annualized (300 days) | €14,400-€24,000/year |
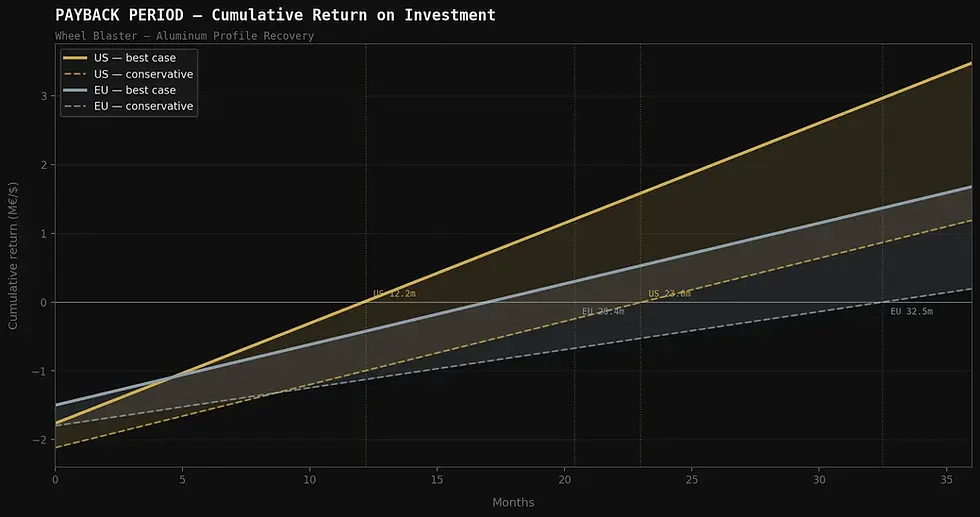
TCO and ROI
US — mid-size plant | EU — mid-size plant | |
$1.764M-$2.117M | Capex — machine + handling | €1.5M-€1.8M |
$930,000-1,335,000 | Vector 1 — annual benefit | €553,200-794,100 |
$150,000-375,000 | Vector 2 — annual benefit | €97,200-241,500 |
$22,500-$37,500 | Vector 3 — annual benefit | €14,400-€24,000 |
$1,102,500-1,747,500/year | Total annual benefit | €664,800-1,059,600/year |
12.2 - 23.0 months | Payback period | 20.4 - 32.5 months |
The machine opex is low by design. Blasting media consumption at fine grain sizes is minimal. A well-built wheel blaster has an operational life of 20 to 30 years. The asset pays for itself and then runs for decades.
Once ROI is achieved, the equipment demands approximately $30,000/year in service, media and spares. Electricity is additional. Everything beyond that is pure profit flowing directly back into EBITDA. Scale these numbers to your plant or corporate dimensions — multiple presses, multiple finishing lines, multiple sites — and the impact becomes significant.
What the numbers do not include.
Rework costs. Late delivery penalties. Customer returns. The cost of a relationship damaged by a defect that reached the customer. These are real costs. They appear in your P&L under different names. The numbers above are conservative. Your real number is higher.
Green investment incentives.
The investment may qualify for EU funding under the Innovation Fund 2025 — open to industrial projects with measurable GHG emission reductions, small-scale track for capex between €2.5M and €20M. The Clean Industrial Deal additionally targets energy-intensive sectors, aluminum included, with over €100 billion mobilized for clean manufacturing.
In the US, the DOE Industrial Decarbonization programs and IRA-related tax credits have historically supported investments of this kind in energy-intensive manufacturing. The regulatory landscape is evolving — current eligibility and available funding require verification with an up-to-date local advisor.
In most markets, public initiatives exist to support companies that undertake green investment policies. The form and size of available contributions vary by jurisdiction — your local advisor is the right starting point. If a technical and economic analysis of the project is required to support a funding application, I am available to help prepare it.
The investment decision.
The capex is not trivial — $1.764M to $2.117M (US) / €1.5M to €1.8M (EU) for machine and handling system. The integration requires engineering. The handling system requires a plant-specific design.
This is why the analysis comes before the purchase. The numbers above give you the order of magnitude. The plant-specific analysis gives you the exact figure — and the confidence to make the decision.
Book the consultation here: https://calendar.app.google/1kQSfJmKeQvtRjTZ6
Summary of contents:
A) assessing the problem. for CXO and operations Managers.
B) equipment that solves the problem and why. for operations Managers and Process engineers.
C) answer to final question, is it worth to? - this post - for CXO and operations Managers.